
Roofing Profit Margins: What the NRCA Data Means for Your Business (& the 3 Numbers That Tell You If Yours Are Wrong)
The number most roofing contractors quote when asked about their margin is their gross margin.
It is the wrong number.
Gross margin tells you how much is left after materials and labor. It does not tell you what you keep. It does not account for the truck that needs new tires, the insurance renewal that came in 18% higher, the office manager you hired in June, or the marketing spend that brought in leads during storm season.
The NRCA reports the average net profit margin for roofing contractors at 2.8%. That is not a gross number. That is what the average roofing company actually keeps after everything is paid.
Half of all roofing companies make less than 2.8%.
This post explains the three numbers that determine whether your margins are healthy or quietly broken, what the industry benchmarks actually look like, and how to know which category your business is in.
The Difference Between Gross Margin and Net Margin (And Why It Matters More Than Most Owners Realize)
A roofing company does a $10,000 job. Materials cost $3,000. Labor costs $4,000. That leaves $3,000, which is a 30% gross margin. Sounds solid.
Then subtract overhead. Insurance, truck payment, fuel, office costs, software subscriptions, and the owner's time for estimating and managing. If overhead runs 28% of revenue, that $10,000 job contributes $280 to overhead coverage. The actual net on that job is not $3,000. It is $200.
On a $10,000 job with a 30% gross margin, the net is $200. That is 2%.
According to Profitability Partners, which has reviewed more than 200 roofing company P&Ls, roofing profit margins look fundamentally different from HVAC or plumbing. The cost structure is heavier on materials, the revenue is more project-driven, and the margin improvement path at scale is flatter than most owners expect.
Most roofing companies net somewhere between 5% and 10%. Well-run operations hit 12% to 15%. That is the realistic range.
The Three Numbers That Tell You If Your Margins Are Wrong
Number 1: Net Profit After Owner Salary
This is the number most owners avoid looking at carefully.
If you pay yourself below market and treat that as "keeping costs low," your P&L looks healthier than it is. A roofing company owner doing $2 million in revenue and drawing $60,000 looks like they are running 8% net. The same owner at market-rate compensation of $120,000 is running 5%.
The net profit that matters for evaluating your business is the number after a realistic owner's salary is deducted as an operating cost. CEO Finance Academy notes that well-structured roofing businesses at $5 million in revenue should have a market-rate owner salary built into overhead and still generate 8% to 12% net on top of that.
If you cannot get there, the margin structure has a problem.
Number 2: Gross Margin by Job Type
Your overall gross margin is an average. That average can mask the fact that some jobs are profitable and others are quietly destroying your margins.
Lightning Path Partners, which reviews roofing P&Ls across companies from $2 million to $30 million in revenue, consistently finds that residential repairs and maintenance generate 40% to 50% gross margins while residential replacements run 30% to 38%. The same company doing repairs hits 12% to 18% net. Shift to replacement-heavy work and margins drop to 8% to 14%.
The contractors running 80% or more of their revenue through replacements are locking themselves into the lower end of the margin range. They look busy. They may even look profitable on a revenue basis. But they are structurally capped.
If you do not know your gross margin by job type, you are averaging out the information you need to make pricing decisions. A job costing system that tracks margin per job category is not a luxury. It is the tool that shows you which work to pursue and which work to price differently.
Number 3: Your Overhead Rate Versus Your Overhead Allocation
There is a version of this problem that kills companies slowly without anyone noticing until it is too late.
Overhead runs 28% of your revenue. But you are allocating it into your bids at 15% because that is what felt right when you started pricing. Every job you sell is covering 13 cents on the dollar of overhead that you are not charging for.
BuildFolio's contractor overhead research shows that most successful contractors maintain 25% to 45% overhead as a percentage of revenue. Solo operators run lower. Companies with office staff, multiple crews, and fleet costs run higher.
The formula is straightforward. Total overhead costs divided by total revenue equals your overhead rate. That rate should be the floor of what you add to every job before calculating profit margin.
If you have never calculated this number from your actual financials rather than estimating it from memory, calculate it today. The gap between what you assume and what you actually run is where the margin goes.
Industry Benchmarks: Where Does a Healthy Roofing Company Actually Stand?
The following ranges come from actual P&L data reviewed across roofing companies at different revenue levels, not survey estimates.
Gross margin: 25% to 40%. Top performers hit 35% to 40%. Companies running below 25% have a cost control problem, a pricing problem, or both.
Overhead as a percentage of revenue: 18% to 30% for well-managed operations. Overhead creep above 30% is one of the most common ways scale destroys margin.
Net margin after owner salary: 8% to 12% is solid. 12% to 15% is strong. Above 15% indicates intentional overhead management and job-level profitability tracking. Below 5% is the danger zone.
Materials as a percentage of revenue: 22% to 28%. If materials are running above 30%, there is either a waste factor problem, a supplier relationship problem, or both. NRCA benchmarks for residential replacement work put materials at 33% to 35% of revenue, though this varies by market and system.
Labor as a percentage of revenue: 32% to 38% using correctly loaded rates. If your labor line is below 32% using loaded rates, you are either under-accounting or running very lean crews with high productivity. If it is above 40%, something in the labor model has a problem.
Why the 2.8% Average Exists
The NRCA's 2.8% average net margin is not a mystery. It is the predictable output of several compounding mistakes that are common across the industry.
Labor is priced at the unloaded wage. The roofer earns $24. He costs $37. Every estimate written on $24 has a hidden $13 per hour deficit built in before the job starts. Across a four-man crew on a three-day job, that gap is over $1,200. On 40 jobs a year, it compounds to $50,000 or more in unrecovered labor cost.
Overhead is guessed rather than calculated. According to RoofPredict, 68% of mid-sized contractors fail to track indirect labor costs like crew travel time and job walk-throughs, which can consume 12% of a project's labor budget. If overhead is not tracked per job, it is being recovered inconsistently, which means some jobs absorb it and others do not.
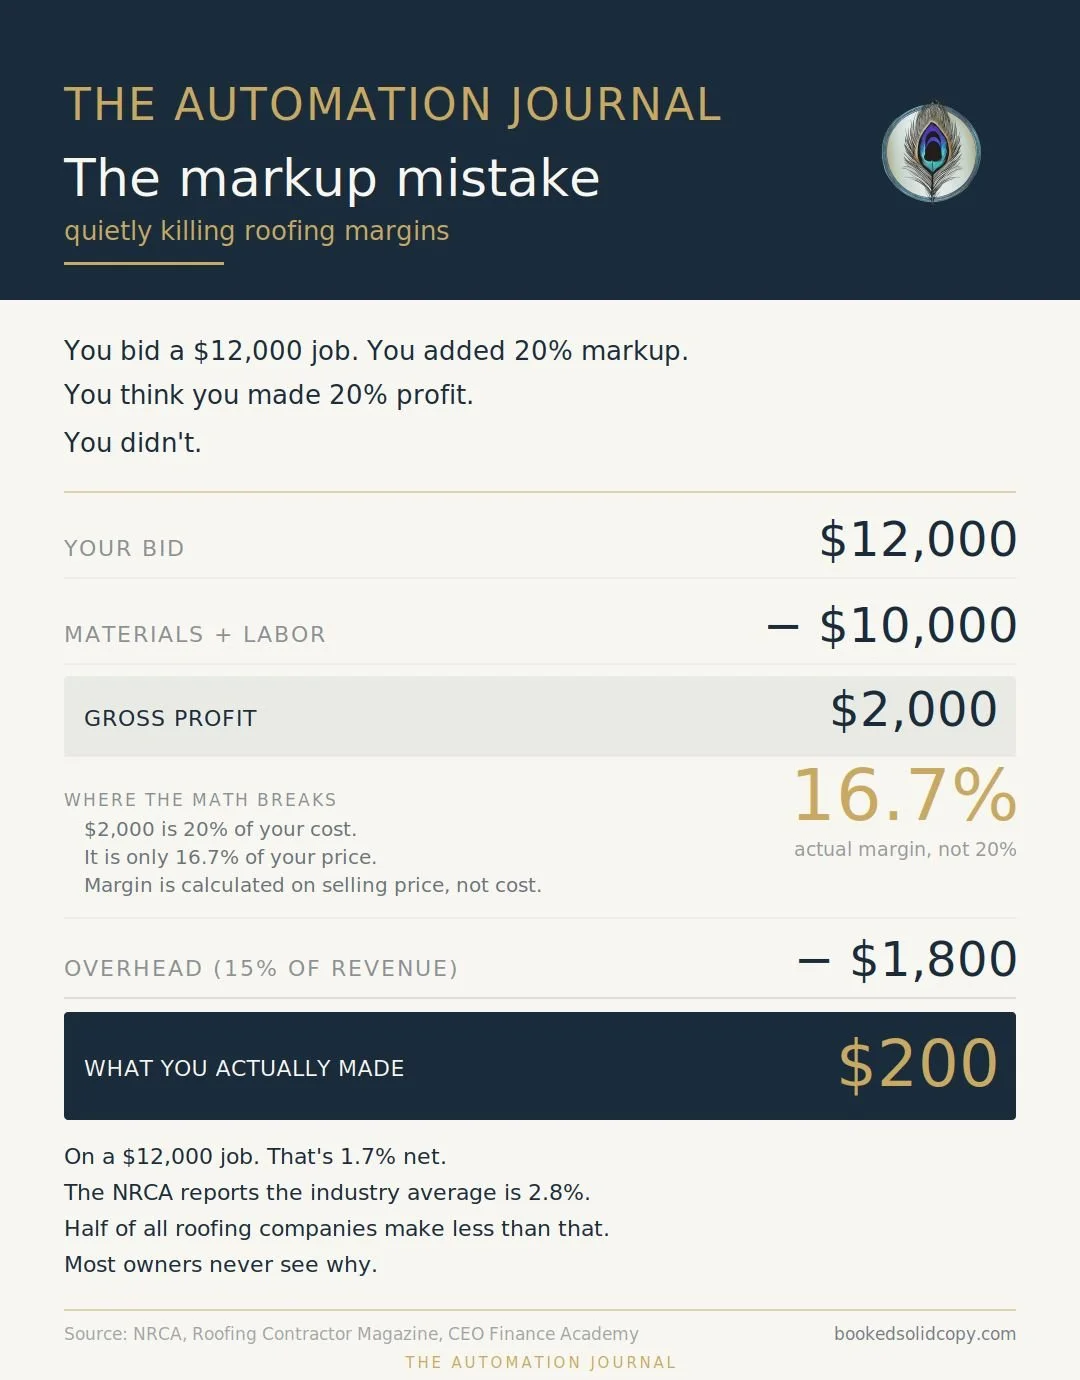
Margin is calculated on cost rather than sell price. Adding 20% to a $10,000 job cost gives you a $12,000 bid. The margin on that bid is not 20%. It is 16.7%, because the margin is calculated on the selling price, not the cost. Every contractor who learned to bid by adding a percentage to cost has been systematically miscalculating margin since day one.
Seasonal cash flow is not factored into pricing. Construction employment data from the Bureau of Labor Statistics shows roofing revenue concentrates in three to four months per year. If pricing does not account for the cost of carrying overhead through slow months, the margin that looks correct in July is not covering what October requires.
What Fixes the Number
The path from 2.8% to 8% or better is not complicated. It is disciplined.
Calculate your true loaded labor rate and use it in every estimate. Not the wage. Not an approximation. The actual cost per productive hour after workers’ comp, payroll taxes, and non-productive time are accounted for. The calculation is covered in detail here.
Calculate your actual overhead rate from your financials, not from memory. Total overhead divided by total revenue. Use that percentage as the minimum overhead allocation in every bid.
Calculate the margin on sell price, not the cost. If you want a 20% margin on a job with $10,000 in costs, the bid is $10,000 divided by 0.80, which equals $12,500. Not $12,000.
Track gross margin by job type for at least one full quarter. Find the job categories that are pulling your overall number down and either reprice them or stop pursuing them.
Build a 12-month cash flow model so that peak-season decisions are made with full-year visibility. The seasonal cash flow framework is covered in detail here.
The Estimation System Connection
Every one of the fixes above requires that your estimation process captures and calculates the right numbers consistently.
A manual spreadsheet or a generic template does not do this reliably. It requires updating when comp rates change, when overhead shifts, and when crew composition changes. Most contractors update their templates once and then use them for three years while their actual costs move.
A custom estimation tool built around your real numbers encodes the correct rates once and applies them automatically to every quote. When your workers’ comp renews, you update one number. When overhead climbs, you update the allocation. Every future bid reflects the current reality without recalculating from scratch.
The contractors I build these tools for stop estimating by feel and start estimating by formula. The margin improvement that follows is not dramatic immediately. It builds over quarters as the compounding error stops compounding.
If you want to know what your current margin gap looks like on your specific job volume and cost structure, reach out directly. I look at these numbers with every roofing contractor I work with before building anything.
Summary
The NRCA's 2.8% average net margin is a signal, not a standard. It tells you what most roofing companies end up with when labor is undercosted, overhead is guessed, margin is miscalculated, and cash flow is managed by feel.
The three numbers that tell you whether your margins are healthy: net profit after owner salary, gross margin by job type, and actual overhead rate versus overhead allocation in bids.
Most roofing companies do not know all three. The ones that do are running in the 8% to 15% range, while the industry averages 2.8%.
The difference is not luck. It is a set of calculations that most estimating systems never force contractors to make.
Courtney Combs is the founder of Booked Solid Copy, a Lexington, Kentucky-based business that builds custom estimation software for trade contractors. Her tools are built around verified industry data and the actual cost structure of roofing operations.
Read more at The Automation Journal.