
Contractor Profit Margins by Trade: The Real Numbers for 2025
Published on The Automation Journal | Booked Solid Copy
Most contractors know they should be making more money. Few know exactly how much more, or why the gap exists.
This is a reference post built for one purpose: to give trade contractors specific, sourced profit margin benchmarks they can actually compare their own numbers against. Not vague ranges pulled from a software company's marketing page. Real benchmarks, broken down by trade, gross versus net, average versus top performer, with sources cited for every number.
If you run a roofing company, an HVAC operation, a plumbing business, an electrical contracting firm, or a remodeling company, there is a section here for you. Read your trade, find your number, and then honestly compare it to where you are.
Before the Numbers: Gross vs. Net Margin
These two figures get used interchangeably, and they mean completely different things. The confusion between them is one of the most reliable ways a contractor can believe they are profitable when they are not.
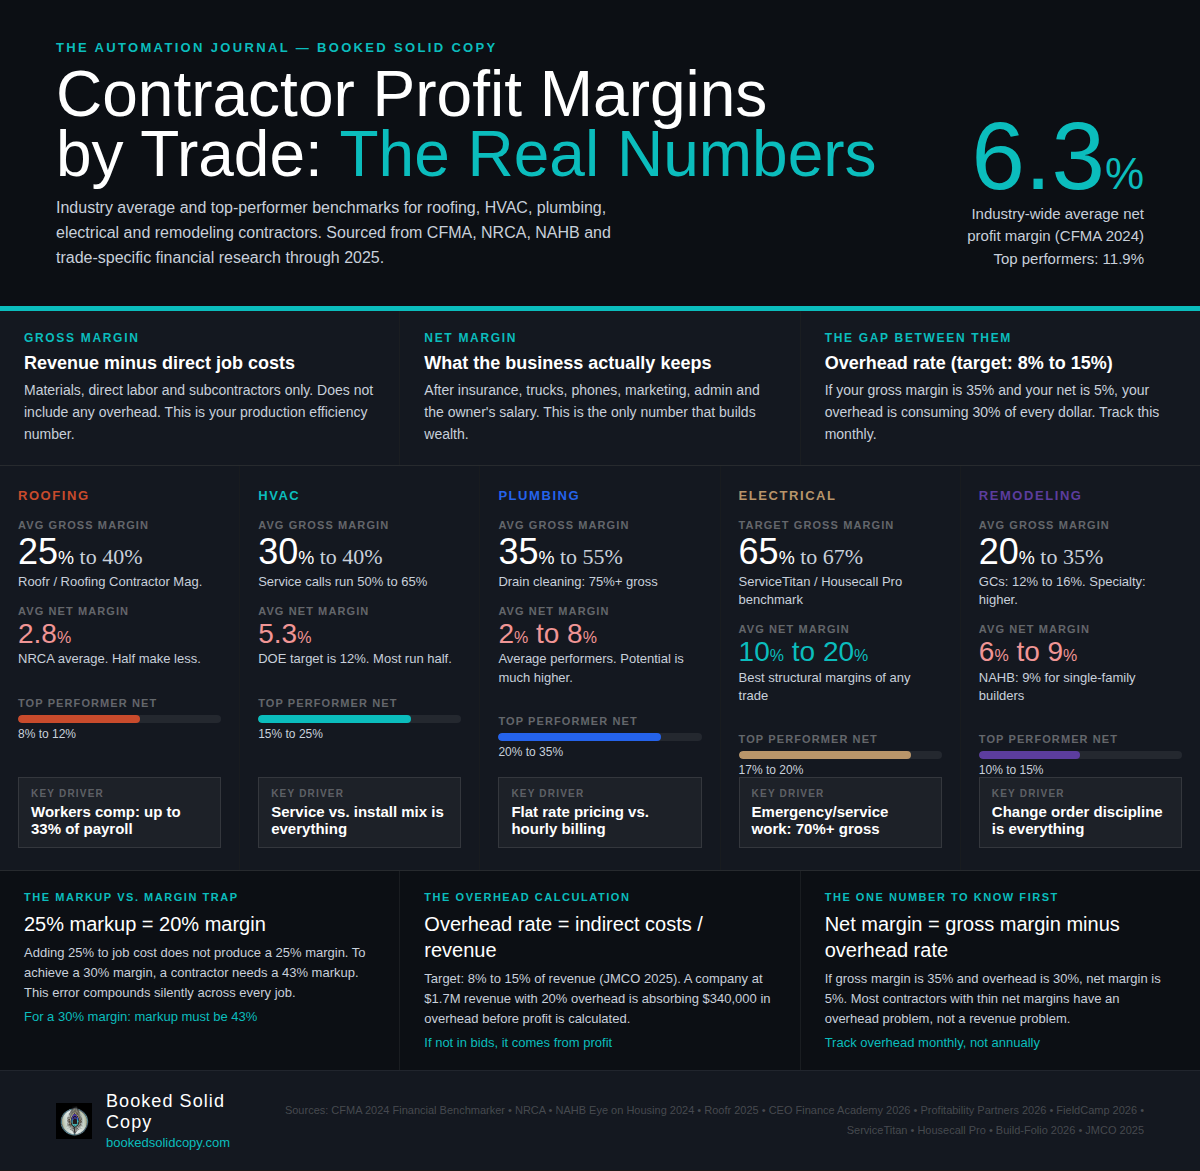
Gross profit margin is the money left after paying the direct costs of a job: materials, direct labor, and subcontractors. It does not include overhead. The formula is revenue minus direct job costs, divided by revenue.
Net profit margin is what remains after every business expense has been paid. Insurance, truck payments, fuel, phones, accounting, marketing, office rent, and the owner's salary if it is structured as overhead. The formula is net income divided by revenue.
A contractor can carry a strong gross margin and still net almost nothing if overhead is uncontrolled. A roofing company might run a 35% gross margin and a 2.8% net margin simultaneously. Both numbers are accurate. They tell completely different stories.
The CFMA's 2024 Financial Benchmarker, which analyzed financial data from 1,290 construction companies, found the industry-wide average pre-tax net income was 6.3% of revenue. The top-performing companies in that dataset reached 11.9% net. The gap between the average and the top is not about working harder or doing more jobs. It is about pricing discipline, overhead control, and visibility into real job-level costs.
Roofing Contractor Profit Margins
Industry average gross margin: 25% to 40% Industry average net margin: 2.8% to 6% Top performer net margin: 8% to 12%
The roofing industry has one of the most dramatic spreads between gross and net margin of any trade. Roofr's 2025 analysis found typical gross margins of 25% to 40%, while net margins after overhead, taxes, and other expenses fall to 6% to 12% for well-managed companies.
The floor is more troubling. The NRCA reports the average roofing contractor nets just 2.8%, meaning half of all roofing companies make less than that. On $1 million in revenue, a 2.8% net margin is $28,000 in profit. That is, before the owner pays themselves anything beyond what they have classified as salary.
Why is the gap so wide? The drivers are consistent across sources. Workers’ compensation for roofing is among the highest of any trade, running up to 33% to 40% of payroll in some states and classifications. Material costs have risen 6% to 10% annually in recent years. And the 90% underbidding rate documented by Roofing Contractor magazine means most roofing companies are systematically underpricing work and cannot see it until the year-end numbers arrive.
CEO Finance Academy's work with roofing company financials identifies the characteristics of strong performers: intentional overhead management, job-level profitability tracking rather than monthly-only P&L review, and a deliberate shift toward higher-margin residential service and re-roof work versus commercial new construction, which compresses margins due to competitive bidding and longer payment cycles.
What to target: 8% to 12% net margin. If you are below 5%, the issue is almost always a combination of underbidding, unallocated overhead, and labor burden underestimation.
HVAC Contractor Profit Margins
Industry average gross margin: 30% to 40% Industry average net margin: 5% to 10% Top performer net margin: 15% to 25%
HVAC has a wider margin of variation by job type than almost any other trade. Service calls and repair work run gross margins of 50% to 65%. Residential installation work runs 35% to 50%. Profitability Partners, which has reviewed more than 200 HVAC company acquisitions, found that the most profitable HVAC companies are not the ones installing the most systems. They are the ones running the most service calls.
The average net margin across the industry sits around 5.3%, according to multiple sources, including Workyard's 2025 HVAC industry analysis. The top performing operations clear 15% to 25%. The difference is not volume. It is the service versus installation mix, flat rate versus hourly billing, and overhead control.
One of the most documented patterns in HVAC is what researchers call the two-to-five technician trap. FieldCamp's 2026 HVAC margin analysis found that solo operators often net 15% to 30%. Add two to three employees, and margins can crater to 5% because overhead outpaces revenue at that company size. The fix is not shrinking back; it is pushing through that overhead threshold with the right service mix and pricing discipline.
The Department of Energy sets the industry standard net profit target for HVAC at 12%. Most HVAC companies are running at less than half that figure.
What to target: 10% to 15% net margin. Service and maintenance work should carry gross margins of 50% or higher. Installation work should not fall below 40% gross. If your blended gross margin is below 40%, review your installation pricing first.
Plumbing Contractor Profit Margins
Industry average gross margin: 35% to 55% Industry average net margin: 10% to 20% (average performers: 2% to 8%) Top performer net margin: 20% to 35%
Plumbing has the most favorable structural economics of the major home service trades. Lower material cost per job relative to HVAC installation, single-technician efficiency on most service calls, and strong emergency pricing power all work in the plumber's favor.
Profitability Partners' benchmark data from more than 200 plumbing acquisitions sets the gross margin target for service work at 60% or higher. Drain cleaning, one of the highest-margin services in the trade, can reach 75% or more because direct labor is the primary cost, and equipment has low consumable expenses.
Despite these structural advantages, Brentwood Growth's analysis of plumbing company financials found that average plumbing businesses operate at just 2% to 8% net profit margins. These companies are busy. They are not building wealth. The gap between their gross margins and net margins is consumed by uncontrolled overhead, inefficient dispatching, and underpricing driven by fear of losing customers.
New construction work is the primary margin drag in plumbing, just as in other trades. Build-Folio's 2026 plumbing margin benchmarks note that new construction plumbing typically runs 10 to 15 percentage points below service work on gross margin, and that companies where new construction exceeds 30% to 40% of revenue need to deliberately manage the blended margin impact.
What to target: 20% net margin is achievable in plumbing for well-run operations. If you are below 10%, price your service calls against a flat rate model, calculate your true overhead rate, and identify what percentage of revenue comes from new construction versus service work.
Electrical Contractor Profit Margins
Industry average gross margin: 35% to 50% (target: 65% to 67%) Industry average net margin: 8% to 15% Top performer net margin: 17% to 20%
Electrical contracting has the highest gross margin potential of any trade in this comparison, but the gap between what is achievable and what most companies actually run is significant. ServiceTitan's industry expert benchmarking sets the gross margin target at 65% to 67%, a figure that supports a net margin of 17% to 20%.
Most electrical contractors are nowhere near that. Housecall Pro's electrical margin analysis found that while 65% to 67% gross margin is the target, most companies run at substantially lower levels and net between 10% to 20% when gross margins are managed correctly.
The driver of higher margins in electrical is the same as in plumbing: service, repair, and maintenance work dramatically outperforms new construction on a margin basis. BusinessDojo's 2025 analysis found maintenance and service work delivering gross margins of 60% to 70%, with emergency services reaching 70% to 80% due to urgency premiums and after-hours rates. Residential new construction typically runs 45% to 55% gross.
Company size matters significantly in electrical. Small firms with two to nine employees generally achieve 8% to 15% net margins. Medium-sized firms with 10 to 19 employees often achieve the best net margins at 15% to 20%, benefiting from scale economies while maintaining operational control.
What to target: 65% gross margin on service work, 17% to 20% net margin across the business. EV charger installation, panel upgrades, and solar integration are among the highest-margin growth areas in electrical currently.
Remodeling and General Contractor Profit Margins
Industry average gross margin: 15% to 25% (GC); 20% to 35% (remodeling specialty). Industry average net margin: 6% to 9%. Top performer net margin: 10% to 15%
Remodeling and general contracting carry the thinnest margins of any category in this comparison. Aladdin Bookkeeping's 2025 construction margin analysis found general contractors typically operating at gross margins of 12% to 16% before overhead. Specialty remodelers do somewhat better at 20% to 35% gross, but the net margin after overhead, labor burden, and all operating costs generally lands at 6% to 9%.
The NAHB's 2025 study found an average 9% net profit margin for single-family home builders, which represents the high end of the general contractor category. The CFMA's top performers in general contracting reached 12% net income before tax.
The specific challenge in remodeling is that overhead ratios tend to be higher relative to revenue than in service-based trades, because remodeling projects require more project management, client communication, subcontractor coordination, and site supervision. NAHB data shows the median residential remodeler has five employees and generates $1.7 million in revenue, completing about 15 jobs over $10,000 per year. At those volumes, every percentage point of margin on $1.7 million is $17,000.
Change order management is the single highest-leverage margin improvement available to remodelers. Work performed outside the original scope that is not documented and billed as a change order is work performed for free.
What to target: 10% net margin is a meaningful improvement for most remodeling operations. The overhead ratio should be tracked monthly and targeted at 8% to 12% of revenue. Every job should be cost-reviewed after completion.
The Number Every Contractor Needs to Know First
Before gross margin or net margin, there is one number that predicts everything: overhead rate.
Overhead rate is the total indirect costs divided by total revenue. JMCO's 2025 Construction Performance Benchmarks set the target overhead ratio for well-run construction companies at 8% to 15% of revenue.
If you do not know your overhead rate, every margin number in this post is academic. Overhead is what converts a strong gross margin into a thin or negative net margin. It is also the number most likely to drift without anyone noticing. A company that grows from $800,000 to $1.5 million in revenue and adds staff, trucks, and office space proportionally will often see its overhead rate climb from 12% to 22% without any single decision that looks like a mistake in isolation.
Track this number monthly. Set a target. Measure against it.
What Separates the Top 25% From the Average
The data from multiple sources points to the same three differences between contractors who consistently operate in the top performance quartile and everyone else.
They know their numbers at the job level. A monthly profit and loss statement tells you how the company performed. Job costing tells you which specific work made money. Contractors who compare estimated costs to actual costs on every completed job develop a feedback loop that catches systematic pricing errors before they compound into a year's worth of lost margin.
They price on margin, not markup. A 30% markup produces a 23% margin, not 30%. A contractor who consistently applies a 25% markup while targeting a 25% margin is operating at 20% and does not know it. The math error compounds across every job. A custom estimation tool built around your actual pricing logic makes this automatic. See how it works.
They treat overhead as a fixed target, not a variable. Setting an overhead ratio target and measuring against it monthly is the difference between catching overhead creep early and discovering it at year's end. Overhead does not manage itself. Revenue growth makes it worse if the ratio is not actively monitored.
Use This as a Benchmark, Not a Goal
These numbers represent industry averages and top-performer benchmarks. Your actual margins depend on your market, your service mix, your crew efficiency, and your pricing discipline. Two companies in the same trade in the same city can have margins that differ by 15 points.
The goal of this post is not to tell you what your margins should be. It is to give you enough specific, sourced data to have an informed conversation with yourself about where you actually stand.
If you do not know your gross margin by job type, that is where to start. If you do not know your overhead rate, calculate it before you bid on another job.
The contractors who build durable, profitable businesses are not working harder than the ones who struggle. They are working with better information.
Booked Solid Copy builds custom estimation and automation tools for trade contractors, with one-time fixed pricing and no monthly fees. Schedule a call to talk through your numbers.